
We crunched the numbers on the last 6 months of client campaigns to help you optimize cold outreach towards CMOs, VPs and Directors of Marketing.
Table of Contents
Data Disclaimer
This data was pulled from roughly 30 clients over the last 6 months. We work with a range of Marketing Agency, Accounting, Consulting & Professional Services, SaaS, Startup, and Technology companies.
Our goal here is to highlight the relative differences between each segmentation so that you can increase your own running reply rate. There are lots of variables specific to our clients and platform that might make our response rates higher or lower than what you're used to seeing.
- Channels: We contact prospects via Email and LinkedIn Messaging.
- Response Rate: This metric captures every type of human response to a campaign, including "No Thank You" and "Maybe Later" responses.
- Warm Response Rate: We classify a response as Warm if the prospect is showing interest in booking a meeting or learning more about the company.
Time in Position
Targeting prospects that have been Recently Hired is one of our most effective Data Signals (our team refers to events or buying triggers as "Data Signals"). The data below is for CMOs, and it's clear that getting in front of them during their first 6 months on the job is a great tactic. The overall response rate is marginally higher, but the Warm response rate, ie. their openness to having a conversation, is more than double.
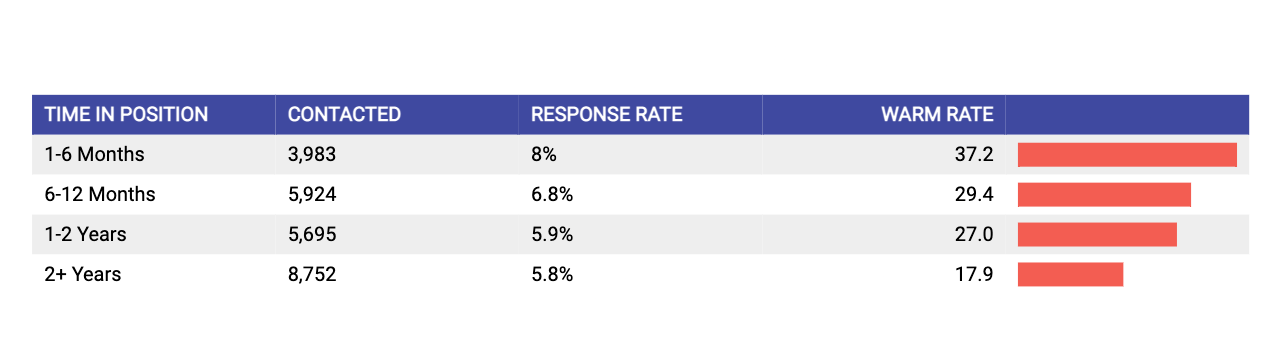
| Time in Position | Contacted | Response Rate | Warm Rate |
|---|---|---|---|
| 1 - 6 Months | 3,983 | 8% | 37.2% |
| 6 - 12 Months | 5,924 | 6.8% | 29.4% |
| 1 - 2 Years | 5,695 | 5.9% | 27.0% |
| 2+ Years | 8,752 | 5.8% | 17.9% |
Outreach Channel
We always expect a higher reply rate on Email than LinkedIn. That being said, if a prospect does reply on LinkedIn, they are more likely to be interested. This is especially true for Heads of Marketing. Try softer selling LinkedIn messages that immediately offer something of value to increase your reply rate.
| Channel | Contacted | Response Rate | Warm Rate |
|---|---|---|---|
| 16,648 | 6.6% | 17.0% | |
| 15,789 | 2.3% | 54.8% |
Seniority
There is surprisingly no clear story here. One might expect to see Managers respond at a much higher rate than C Level, regardless of company size. However based on this data, we would recommend testing all seniority levels as long as your messaging is relevant to all positions.
| Months in Position | Response Rate | Positive Rate |
|---|---|---|
| CMO / Chief | 6.0% | 28.4% |
| VP | 5.6% | 26.9% |
| Director | 6.8% | 23.3% |
| Manager | 6.9% | 26.5% |
Gender
We've heard some theories that it's easier to do outreach to female prospects. Our data shows an identical response rate and very close Warm rate, with males actually higher than females. This data doesn't take into account the gender of the person sending the outreach, which could definitely have an influence on the results.
| Gender | Contacted | Response Rate | Warm Rate |
|---|---|---|---|
| Female | 11,607 | 6.2% | 24.2% |
| Male | 9,625 | 6.2% | 28.2% |
Industry
Some industries inherently respond at a higher rate, but don't convert to meetings due to lack of budget or decision making power. For example, you can see below that Non Profits respond at almost twice the rate as Technology companies, but their Warm rate is much lower.
While Technologies might be hard to get in front of initially, when they do respond, they are more interested in booking meetings.
| Industry | Contacted | Response Rate | Warm Rate |
|---|---|---|---|
| Non Profit | 1,665 | 9.4% | 14.1% |
| Professional Services | 5,286 | 7.0% | 27.5% |
| Consumer Discrentionary | 9,149 | 6.4% | 23.9% |
| Technology | 7,093 | 5.3% | 32.5% |
| Industrials | 1,696 | 4.4% | 22.7% |
Country
Is anyone surprised that Canadians are 50% nicer than Americans?
| Country | Contacted | Response Rate | Warm Rate |
|---|---|---|---|
| 🇺🇸 United States | 24,159 | 6.4% | 26.5% |
| 🇨🇦 Canada | 941 | 9.6% | 25.6% |
Company Size
The general trend here is that Marketing Leaders at smaller companies will be more willing to talk to you. If you contact 1000 prospects at 11-25 employee companies, you could end up 28 interested prospects. If you did the same outreach to a companies with 1000+ employees, you could end up with closer to 8 interested prospects...a difference of 20 potential meetings.
| Size | Contacted | Response Rate | Warm Rate |
|---|---|---|---|
| 1-10 | 2,010 | 8.5% | 28.2% |
| 11-25 | 2,622 | 8.9% | 32.6% |
| 26-50 | 3,679 | 7.5% | 25.4% |
| 51-100 | 3,814 | 6.4% | 28.6% |
| 101-250 | 4,044 | 6.5% | 22.9% |
| 251-500 | 2,687 | 5.0% | 28.9% |
| 500-1,000 | 2,143 | 5.0% | 19.4% |
| 1,000+ | 3,399 | 3.4% | 23.3% |
Takeaways
Depending on where you are at in getting your cold email outreach program setup, you could be trying to optimize either your over response rate, or you warm response rate.
Goal #1: High Overall Response Rate
If you are just starting a Cold Outreach program, you probably have lots of testing ahead of you to find the pitch that converts CMOs.
A high response rate is usually indicative of campaigns that are non-spammy and, at minimum, contains messaging that real people are willing to respond too. Even if that response is a "no thank you," that's much better than someone hitting the spam button.
Some ideas for testing:
- Go after smaller companies than you might eventually want. This allows you to try out your pitch on the smaller, high-responding companies before moving up the ladder.
- Target less senior people. If they don't like your pitch, the CMO probably won't either.
- If your product or service is industry-agnostic, avoid low performing, hard to reach industries in the beginning until your pitch is dialed in.
Putting that all together...you might target companies with 1-50 employees, in the non profit space, who recently hired a Marketing Manager. This will increase your chance of getting a response, providing valuable insights into your pitch and objection handling.
Goal #2: High 🔥 Warm Response Rate
A high warm rate is directly related to your number of booked meetings and closed deals. If you are getting a Warm response rate of 40-50%, you are in good shape by our standards.
If not, going for some softer-selling copy and combining some of the strongest characteristics above might just help you get there!